Introduction
Data Analysis Expressions (DAX) is the powerful formula language that powers calculations and data modeling in Power BI. Whether you're a data analyst, business intelligence developer, or an Excel power user transitioning into Power BI, mastering DAX is crucial for creating dynamic reports, interactive dashboards, and intelligent business insights.
This guide provides a deep and comprehensive overview of DAX, including syntax, how it works under the hood, use cases, real-world examples, and high-resolution illustrations. It is beginner-friendly and aims to explain each concept in clear, teachable terms.

Table of Contents
- What is DAX?
- Understanding Context: Row, Filter, and Evaluation
- DAX Syntax and Expression Structure
- Basic DAX Functions (Explained)
- Aggregators vs Iterators (Why they differ)
- Logical Expressions in Detail
- Time Intelligence Demystified
- Working with Variables Effectively
- Measures vs Calculated Columns (and when to use them)
- Virtual Tables & Advanced Functions
- Optimization & Performance Tips
- Real Examples with Visual Insights
1. What is DAX?
DAX (Data Analysis Expressions) is a formula language designed to perform advanced data manipulation and analysis in Power BI, Excel's Power Pivot, and SSAS Tabular models.
It resembles Excel formulas, but it’s designed for columnar database engines and works with relational data models.
DAX lets you:
- Perform row-level and group-level calculations
- Create calculated columns and dynamic measures
- Build KPIs and aggregations on large datasets
- Define time-intelligence metrics (YTD, MTD, YoY)
Example:
Total Sales = SUM(Sales[Amount])
This formula defines a measure called "Total Sales" by summing all values in the Sales[Amount] column.
2. Understanding Context
DAX behaves differently depending on the context. There are two primary types:
Row Context
Row context exists when Power BI is evaluating each row individually. Think of it like Excel’s formula dragging down a column.
For example:
Total = Sales[Quantity] * Sales[Price]
In a calculated column, each row has its own context (i.e., own quantity and price).
Filter Context
Filter context exists when Power BI visuals or slicers apply filters to your data.
A measure such as:
Total Sales = SUM(Sales[Amount])
might return different values in a matrix visual, depending on how it's sliced by region or date.
Evaluation Context
This is the combination of both row and filter context and determines how DAX evaluates a formula in a given situation.
3. DAX Syntax and Expression Structure
A DAX expression is a logical formula written in a consistent format:
MeasureName = Expression
For example:
Profit Margin = DIVIDE([Profit], [Revenue])
- DIVIDE() is safer than / because it handles divide-by-zero cases.
- [Profit] and [Revenue] are other measures.
Core components:
- Function names (e.g. SUM, CALCULATE, IF)
- Column references (TableName[ColumnName])
- Operators (+, -, *, /, &&, ||)
- Constants (TRUE(), FALSE(), numbers, text)
4. Basic DAX Functions (Explained)
SUM()
Adds all the values in a column.
Total Quantity = SUM(Sales[Quantity]) → Create a measure called 'Total Quantity' that calculates the sum of all values in the 'Quantity' column of the 'Sales' table.
AVERAGE()
Calculates the average (mean) of a column.
Avg Price = AVERAGE(Sales[Price])→ Create a measure named 'Avg Price' that calculates the average of all the values found in the 'Price' column of the 'Sales' table
MAX() and MIN()
Returns the maximum or minimum value in a column.
Highest Sale = MAX(Sales[Amount])→ Create a measure named 'Highest Sale' that finds and displays the maximum (largest) value from the 'Amount' column within the 'Sales' table.
These functions work over entire columns unless used with filters.
5. Aggregation vs Iterator Functions (Deep Dive)
Aggregators
These work over an entire column.
Total Cost = SUM(Sales[Cost])
They assume there's one value per row, and they just add it up.
Iterators (X Functions)
These allow row-by-row custom calculations:
Total Profit = SUMX(Sales, Sales[Quantity] * Sales[Unit Profit])
SUMX walks through each row of the Sales table, computes Quantity * Unit Profit, and adds the results.
Iterators are powerful but computationally expensive. Use them when your logic requires evaluating rows individually.
6. Logical Expressions in Detail
IF()
Simple branching logic:
High Revenue = IF(Sales[Amount] > 10000, "High", "Low")
SWITCH()
Cleaner way to handle multiple conditions:
Category = SWITCH(TRUE(), Sales[Amount] < 1000, "Low", Sales[Amount] < 5000, "Medium", "High")
Think of it as a replacement for nested IFs.
AND / OR
Qualified = IF(Sales[Amount] > 10000 && Sales[Units] > 50, "Yes", "No")
Use && for AND, || for OR.
7. Time Intelligence Demystified
DAX has built-in time intelligence to work with date hierarchies.
TOTALYTD()
Year-to-date aggregation:
YTD Sales = TOTALYTD([Total Sales], 'Date'[Date])
SAMEPERIODLASTYEAR()
Useful for YoY comparison:
Last Year Sales = CALCULATE([Total Sales], SAMEPERIODLASTYEAR('Date'[Date]))
Requires a valid Date table with relationships.
8. Working with Variables Effectively
Variables improve readability and efficiency:
Profit Ratio =
VAR Profit = [Total Sales] - [Total Cost]
VAR Revenue = [Total Sales]
RETURN DIVIDE(Profit, Revenue)
- Use VAR to define once and reuse.
- Speeds up execution and helps debugging.
9. Measures vs Calculated Columns
| Feature | Calculated Column | Measure |
|---|---|---|
| Evaluated | Per row (row context) | On demand (filter context) |
| Stored | Yes, takes memory | No, dynamic |
| Use case | Grouping, filtering | KPI, totals, ratios |
Rule of thumb: Use measures unless you need a new field to slice/filter on.
10. Virtual Tables & Advanced Functions
FILTER()
Returns a table that satisfies a condition.
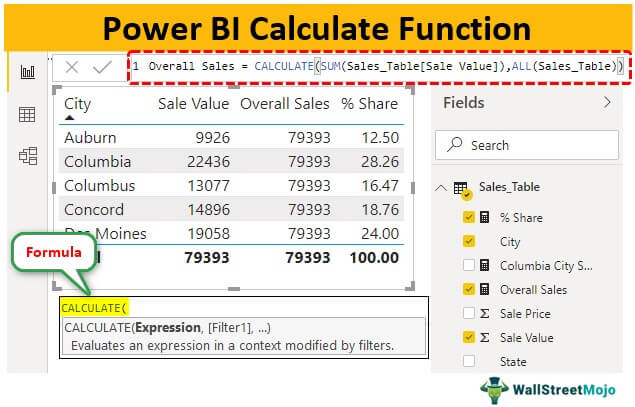
Big Sales = CALCULATE([Total Sales], FILTER(Sales, Sales[Amount] > 10000))
ALL()
Removes filters from a column or table.
All Product Sales = CALCULATE([Total Sales], ALL(Products))
VALUES()
Returns a distinct list of column values.
SUMMARIZE()
Creates summary tables by group.
11. Optimization & Performance Tips
- Prefer measures over calculated columns for performance.
- Use DIVIDE() instead of /.
- Use variables to reduce repeated logic.
- Avoid unnecessary iterators on large tables.
12. Real Examples with Visual Insights
Revenue by Region
Region Sales = CALCULATE([Total Sales], Geography[Region] = "East")
Pair this with a map visual or bar chart.
Year-on-Year Growth
YoY Growth =
VAR Current = [Total Sales]
VAR LastYear = CALCULATE([Total Sales], SAMEPERIODLASTYEAR('Date'[Date]))
RETURN DIVIDE(Current - LastYear, LastYear)
Visualize with a line chart over months.
Final Thoughts
DAX is the analytical engine behind every serious Power BI report. While its learning curve may be steep at first, once mastered, it enables unparalleled control over your data model.
Continue experimenting, study real-world examples, and explore Microsoft’s DAX documentation and the DAX Guide. You’ll go from writing simple sums to building complex, dynamic KPIs in no time!


Comments (0)
No comments yet. Be the first to comment!